Andrew Drinkwater
As Strategic Enrollment Management professionals, we want to do a good job of tracking every scenario so that we can reflect our institution’s plans going forward and measure how accurate our projections were. But planning by spreadsheet tends to give rise to a plethora of confusing files and naming conventions being sent back and forth by email.
Consider the image below: which version of the University plan is really the final one? How come the only Kinesiology plan says don’t use? Is the final Science scenario v6? What if LLee is the Dean….?
How do I figure out what’s different between these scenarios? Am I going to have to use VLookup for it?
Instead, we built Plaid Forecast to track every scenario, and every iteration of a scenario.

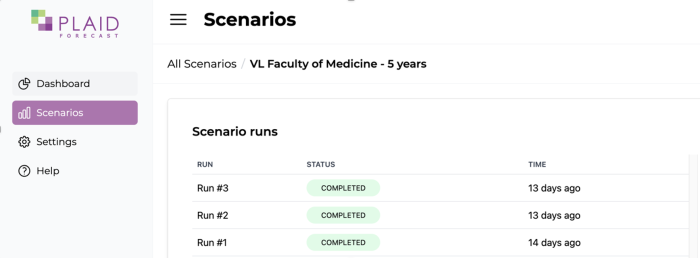
Rather than cobbling together a mess of spreadsheets and determining which version is the right version of the truth, we can see every scenario, and every iteration of a scenario, with just a few clicks.
The beauty of being able to track every change is that you can accurately see how your plans changed over time, how they compare with other plans, and how accurate your planning was.
Maybe you didn’t expect that AI would become such a hot topic in 2023, and didn’t foresee an explosion in demand for your data science programs.
When this happens, with Plaid Forecast you can update your planning in real time as new information becomes available:
- Over-enrollment in one area, such as data science, means you can pull back in another area that may be struggling to hit their target. This should drive two actions:
- Your base actuals should update. If your target was 100 but you know you will get 150, your operational plan should reflect that new reality. Our system will pull this information automatically and update on a schedule that you choose. This creates a scenario iteration automatically.
- You may want to re-target. Perhaps your Geography program is having a tough time finding enough applicants for their pool this year. You could drop their operational target on the notion that the overall institution target will be fine. This creates a scenario iteration based on human’s making contextual decisions.
- Over-enrollment in one area, such as data science, may also have a knock on effect in other areas. By updating your assumptions on a regular cadence, you can better communicate this change. An increase in data science students will almost always produce an increase in demand for math, statistics, and computing science courses. The Dean responsible for those areas would be grateful to get an early heads up that they need to add more seats to classes.
The other scenario we often see needing to make adjustments like this is when applicants shift their preferences for when to begin their studies. Perhaps an applicant decides they want to start in the Winter intake instead of the Fall intake. Your enrollment forecast should update to reflect this change. With Plaid Forecast, you can:
- Detect automatically that behaviour has shifted and there are more students beginning in Winter versus Fall.
- Move your targets from one term to another.
By doing this, you can see what the impact will be in real time.
Scenario planning is one of the most impactful things you can do in Strategic Enrollment Management. It allows your institution to better plan for what happens when things change, and it can be automated to update in near real time if you need. But, it's very hard to keep track of all those scenarios unless you have a robust system that was designed for collaboration from day one.
Could we help you get there? Why not redistribute your analytics skills away from sorting, organizing, and reconciling spreadsheets into uncovering the signal amongst the noise and helping your institution achieve its goals. Want to learn more?