Modelling Impacts of International Study Permit Changes in Canada
Since summer, the Canadian federal government has been musing about cutting back on new international student study permits. Well, it finally happened. This post discusses some of the potential impacts, and provides an forecast of how enrolments will change as a result of this new policy.
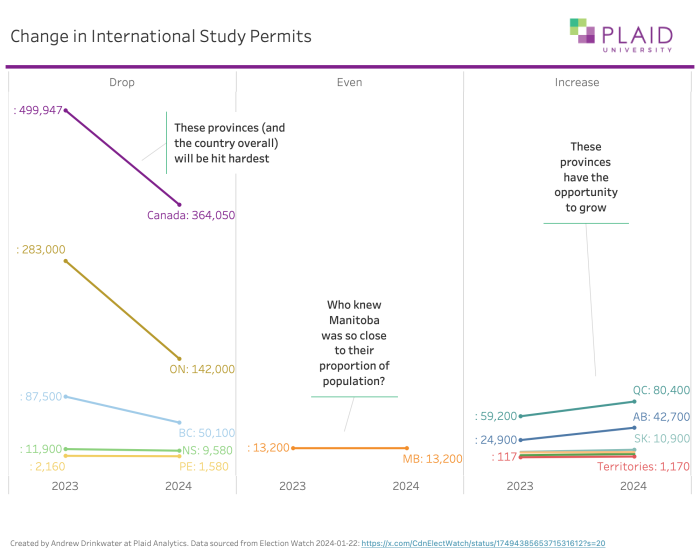
On Monday, the government released a policy announcement that they are going to cut back on new study permits, dropping by 35% below 2023 levels. The new cap for 2024 will be 364,000 permits, and it will be distributed according to provincial population. They say this is because this category of temporary resident is having an outsized impact on the housing market and Canada’s ability to deliver healthcare.
This distribution is going to be an interesting challenge. Election Watch and Alex Usher suggest some provinces will have to cut noticeably while others will have room to grow (whether they can fill these growth targets remains to be seen).
As many of you know, Plaid Analytics is building the world’s best enrolment forecasting platform. While we work primarily with universities and colleges, we thought we’d put our tool through its paces and see if it could work for a national system divided into provinces/territories and universities/colleges. I’ll talk more about this process, including the methods and caveats of this approach, shortly.
We used Plaid Forecast to create four scenarios:
- Scenario A: 2021 -> 2022 -> 2023 Compound Growth Rates Continue (No Change in Policy or Demand)
- Scenario B: Intakes Capped at 2023 Levels
- Scenario C: Allotment Undergrad + Compound Growth Grad
- Scenario D: Realistic Undergrad + Compound Growth Grad
To do this, we: made a fake institution, estimated study permits and retention rates, and ran these scenarios through Plaid Forecast to project how many students there would be in the system over a 5 year period.
This work is extremely preliminary. We think the broad trends are going to be similar to this projection, but the specific details will vary considerably as both institutions and applicants adjust their behaviour in light of the changes. Please see Methods & Caveats below for more details.
Preliminary Results
Study Permits, Intakes, and How Many Show Up?
Depending on your jurisdiction and institution type, this could be very painful (Ontario, particularly with regard to what happens to the public private partnership institutions), painful (British Columbia, and arguably Nova Scotia and Prince Edward Island though the overall numbers are smaller), pretty much status quo (Manitoba, New Brunswick), and room to grow (Quebec, Alberta, Saskatchewan, Newfoundland and Labrador, the Territories). Now, the tricky part here is whether the jurisdictions with space to grow will be able to, and whether some private institutions may relocate from painful to room to grow provinces.
It’s sounding like Alberta should be able to ramp up, but that Quebec may struggle to attract enough international students due to fewer French speaking international students.
At this point, it is unclear what happens if jurisdictions fail to fill their quota. While it would be nice to be able to redistribute those seats when needed, by the time we know that the quota won’t be met, it will be too late to open doors wider elsewhere. Short of the government adopting a three-year moving average or similar, they may just go unfilled. Besides, if the real rationale behind these moves is to help tame the housing market, especially in Ontario and BC, you wouldn’t want those jurisdictions absorbing the slack. I’m skeptical of what the real motivation is, of course.
Gross vs Net
The other key point I’m seeing raised by enrolment professionals is the gross vs net.
Institutions provide offers of admission while IRCC issues study permits; not all applicants who are admitted will apply for a study permit, and not all admitted applicants will chose to attend a school in Canada. We can think of these as the gross number of applicants admitted and gross number of permits issued.
However, it is ultimately the student who decides if they are actually coming to study. We can think of this as the net number of study permits utilized. I have not seen data on the typical melt between the gross and net numbers, but my impression is it can fluctuate from year to year.
For example, Northern College revoked 500 admission offers last summer (and 200 more later) due to challenges with these projections:
David Francis, director of strategic initiatives for Northern College, said it's the responsibility of Northern College to estimate how many visas will be approved ahead of each semester. That means the school gives out more acceptance letters than it can accommodate under the assumption that some of the applicants will have their visas denied.
“As we look at program capacities, they are moving targets,” Francis said.
Additionally, Francis said many students apply to multiple schools. As part of its estimations ahead of each semester, Northern College assumes some of the students they accepted will choose to enrol in different institutions.
(CBC.ca)
I haven’t been able to find public data that suggests what the actual melt rate is on these permits. If anyone has such info, please let me know – I’d love to update this post and the projections with better assumptions.
But for sake of argument, let’s say a good year means 90% of the total 364,000 study permits issued ultimately show up in class. That means the new cap is really 327,600 (-36,400 from base). If only 80% show, it’s 291,000 (-72,800). Given the average rate of international tuition in 2023 was $36,100, these could be substantial cuts ($1.3-2.6bn) on top of the cut of having a cap in the first place.
So here’s hoping there is some wiggle room and acknowledgement that not all students end up coming, for various reasons.
Total Student Projections (Headcount)
This issue will not be solved overnight. It will take time! There’s a lot of moving parts, and lots of decision-making, both institutional and individual, that needs to be sorted out.
Remember, post-secondary student enrollments don’t work like airline ticket purchases. You can’t just turn off supply and they no longer have the ability to purchase. Plenty of students stick around until their credential is complete – and many stay longer than the length of their program for various reasons. But for sake of argument, let’s say students in certificate programs are here about 1 year, diploma programs about 2 years, baccalaureate degree programs about 4 years, master’s about 2 years, and doctoral about 6 years. A common metric for program completion is to measure what percent complete in 150% of program length. Each institution will vary, but we can credibly say that for colleges that primarily offer 2-year programs (or shorter) the longer impact will be felt over about three years, and for universities and colleges primarily offering 4-year programs, the impact will be felt over about six years.
Here's the thing: many institutions have been growing their international populations in leaps and bounds for years. At a university, if last year was a record year for 1st year admits, then next year will be a record for 2ndyear enrolments, the year after for 3rd year, and the year after for 4th year. Then rinse and repeat for however many years they’ve been growing.
A test I greatly enjoyed running when I worked in a research university was the “when do we run out of jobs test”. In that test, we “stopped” admitting students at all. Then measured how long it would be before we ran out of students enrolled (and we all lost our jobs). It took years…
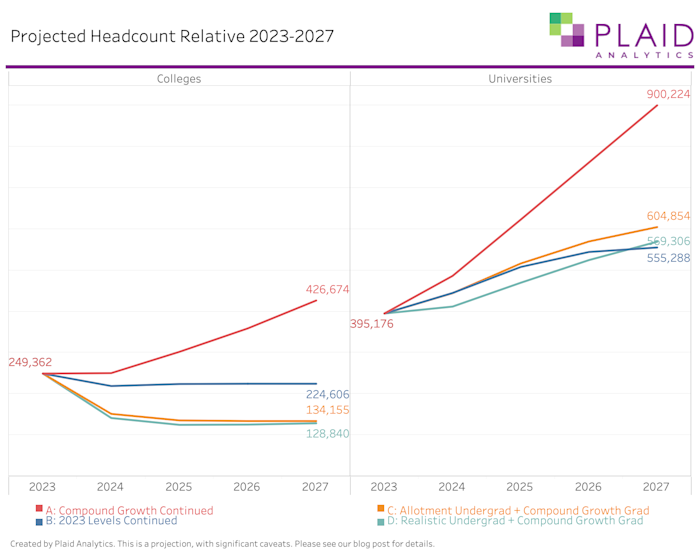
Here’s what we’re projecting for headcounts. Take this with a massive grain of salt (explanation below).
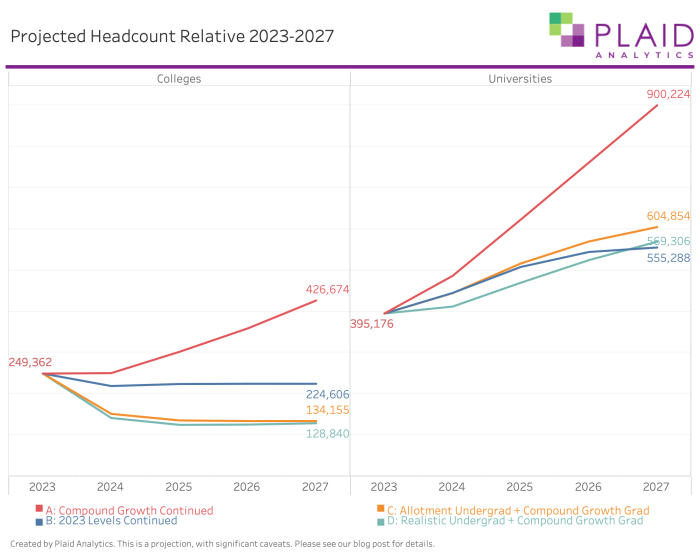
Results
If growth continues unabated (Scenario A, red line), the sector will roughly double in 5 years. That sounds like a lot, but it’s a 15% growth rate per year. We’ve seen about 16.7% per year in new study permit increases between 2016 and 2023 (note that we’re using a Dec-Nov year here because IRCC hasn’t released Dec 2023 numbers).
If we use the new IRCC allotment announced on Monday (Scenarios C and D), colleges will shrink but universities will continue to grow. The logic here is that master’s and doctoral programs are exempted from the new allotment, and universities will be the primary beneficiaries. While at most universities, tuition for research program graduate students is generally offset by institutional support (teaching assistantships and sessional instructor appointments, research assistantships, and scholarships) the same is not true for course-based master’s programs and this seems the logical pivot for institutions to reduce the impact to income levels.
Ironically, if we just flatlined the intakes at 2023 levels (Scenario B), colleges would lose far fewer enrollments than we project in Scenarios C and D. Universities would also grow, but it would start to level off in 2025. The primary difference here is that the flatlining intakes scenario (B) would also flatline graduate intakes - this would benefit universities less and colleges more.
Overall, having this cap in place cools the flames of growth, which I suspect was the point.
What Comes Next?
There’s going to be a lot of work for institutional planning over the next little while. I imagine many of you will discover your models weren’t built to handle this scenario and you need to move fast (we can help, by the way).
A few trends that we think will emerge quickly:
- The growth of professional master’s programs is going to go into overdrive. It’s one area that institutions are already good at planning and growing and it is exempt from the cap. Expect to see a lot of new programs in this space very quickly, but this is really a university-specific response.
- We’re entering a zero sum era for international students in Canada. We expect heightened competition across provincial boundaries for international students. It’s also possible there will be more competition within provinces, but that depends on how the provinces roll out their allotments.
- Many institutions will be in a really tough spot for a while and will benefit greatly from empathy as they chart their next steps.
- The existing model of Public Private Partnership institutions offering public college curriculum in Ontario will change drastically with the changes to the Post-Graduate Work Program.
Many students will fear for what happens to them. My career started as an academic advisor for a university that was shut down and absorbed into another. I cannot stress enough reaching out to your students and letting them know you will support them through this no matter what (you’re also contractually obligated to, in most cases).
There are still many moving parts to this and, as always, the devil is in the operational details. How will provinces distribute their allotment between institutions? Will IRCC be flexible at all on overall numbers of permits issued due to melt as students don’t arrive? Will institutions “hold back” some of their allotment – the IRCC caps are presumably calendar year based while most students start study in September, and admission offers generally precede study start by 4-9 months – at the risk of not using the full allotment, or will they get offers out as early as possible at the risk of having to cut off international admissions early in the year?
Methods & Caveats
Methods
To create these scenarios, we:
- Estimated new and existing study permit holders by level and institution type within provinces/territories. This encompassed assumptions on gross vs net permits.
- Made a fake institution called “IRCC”, with each province representing a “program” within this institution. The type of institution (university / college) is a residency.
- Estimated retention rates by credential type using Statistics Canada’s Post-Secondary Student Information System.
- Used Plaid Forecast to model these scenarios and compare them.
- Used an estimated 0.75 Full-Time Equivalent to headcount ratio.
- Combined information about tuition rates to estimate a financial impact.
Caveats
As mentioned, all of this should be taken with a massive grain of salt. There are two primary reasons:
- We could not find gross to net study permit data. This means we made an assumption about what proportion of study permits issued would be used.
- We could not find national retention data by institution type, credential level, and year level within that credential. Therefore, we made assumptions about retention rates from years 1-6. College retention rates dropped substantially after year 2, and universities after year 4.
- All of this is a projection based on behaviours we have seen at many kinds of institutions. Real behaviour will look different. For our institutional clients – your data is way better than the public data, and we can help you work on the nuance more easily. That simply isn’t true with public data.
We’d love to see a day where Statistics Canada had an up-to-date Post-Secondary Student Information System that can be accessed via a modern API. IPEDS and NSC, despite their flaws, are good models in the US and include enrolment and retention data. But we’d go beyond what they have to support more detailed application, retention, and completion data. To get there, both the government and institutions would have to place a higher value on transparency, data reporting, and automation.
Wouldn’t it be great to have monthly (or daily?) data updates on the sector? Imagine how difficult it must have been to create a cap when PSIS data is two years old. This isn’t a problem we need to have, and using the current scenario as an opportunity for leadership would be apt.
What Does This Mean for Your Institution?
The effects are likely to be distributed unevenly. Your students (and prospects) will behave differently than at other institutions, and it's likely your institution will respond to these challenges in different ways.
Plaid Forecast can help you plan for the different possible scenarios, using your own data that is much more reliable than what we can get from the public data portals. We're seeking innovators who want to do better enrolment planning, faster.
It took us literally minutes to generate these scenarios. I imagine there are many institutional research offices going full out this week and they won't have their scenarios finalized for a while.
If you need help figuring out what these new rules could mean for your institution, we can help. Quickly.
As a bonus, it’s still possible to onboard within this fiscal year to enable better planning for Fall 2024 and beyond.
Want to see a demo? Book a meeting with Plaid Co-founders
Gratitude
I am immensely grateful to Patrick Lougheed for his efforts in creating the “IRCC” institution, modelling what data we had (and didn't), refining our estimates, and pointing out the gaps. Without him, there's no way we could have made this starting point analysis.
It took us about 2 days to create a fake institution based on public data, but more importantly it took us about 20 seconds per scenario to run the models. If you're one of our client institutions, know that you can have highly accurate scenarios in minutes - please reach out if you need a hand defining them.