Tripling Your Tuition Revenue?

Happy New Year everyone! I hope you had a restful break.
For the majority of my career, I’ve lived at the intersection of data, analytics, technology and operational business. I serve as a translator and help those who run the “business” aspects of the institution work effectively with those who maintain the technology.
Integrating enrolment and tuition forecasting provided an opportunity to further hone these skills. Turns out, when you combine growth scenarios for both the number of students and the rate they pay, you get into big numbers in a hurry.
Let’s take a simple example:
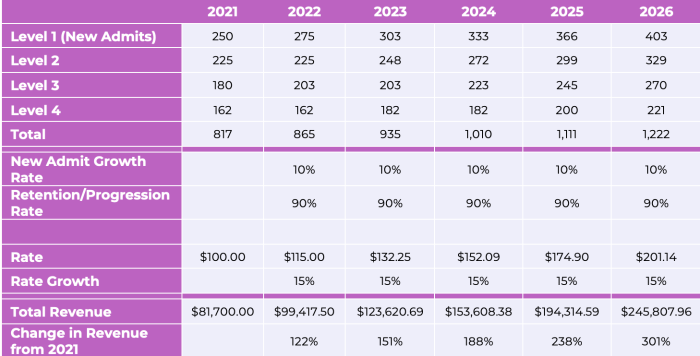
Assume that today you have 1000 students. Each student takes exactly 4 years to finish their program (I know, I know – this is uncommon at best). Based on these assumptions, we admitted 250 first-year students this year. Their retention rate through each year of study is 90%, so we lose a few students between each year level.
Further assume that for five years, we have a 10% growth in new intakes each year and a 15% growth in the rate charged to all students. Let’s assume that rate starts at $100 (I know, wildly unrealistic. Call it $5,000 or $30,000 if you wish – the growth rates are the same).

Poof – you’ve now tripled your revenue in only five years. All from growing student intakes by 10% per year and rates by 15% per year.
I’m providing this tongue-in-cheek example as many people struggle with non-linear growth patterns, and overlooking those patterns at this time of year could result in erroneous conclusions.
Operationalizing that plan will take some work, of course: recruit more students, retain more students, modify your curriculum, or adjust your intake standards. All non-trivial. On the financial side, board approval may require consultations with impacted students aimed at minimizing financial hardships through targeted financial aid.
How do you keep your stakeholders attuned to how different growth rates can impact the totals in ways that aren’t always obvious?
