Why Write Code?

At this point, I’d say I’m a grizzled old SQL veteran. SQL is Structured Query Language, a way to access the data stored in relational database systems, such as those that live behind many Student Information Systems. Data stored in multiple tables that need combining in creative or standard ways to produce reports? Got it. Need lists of who your students are, or identification of students who should be contacted about X? Got that too. I’m most proud of the work I did to support student retention and enrolment planning when I worked at Simon Fraser University and the University of British Columbia. Through this, I’ve built data warehouses, and written more PL-SQL than I ever thought possible.
Clearly, I love SQL. But do I use it anymore? Rarely.
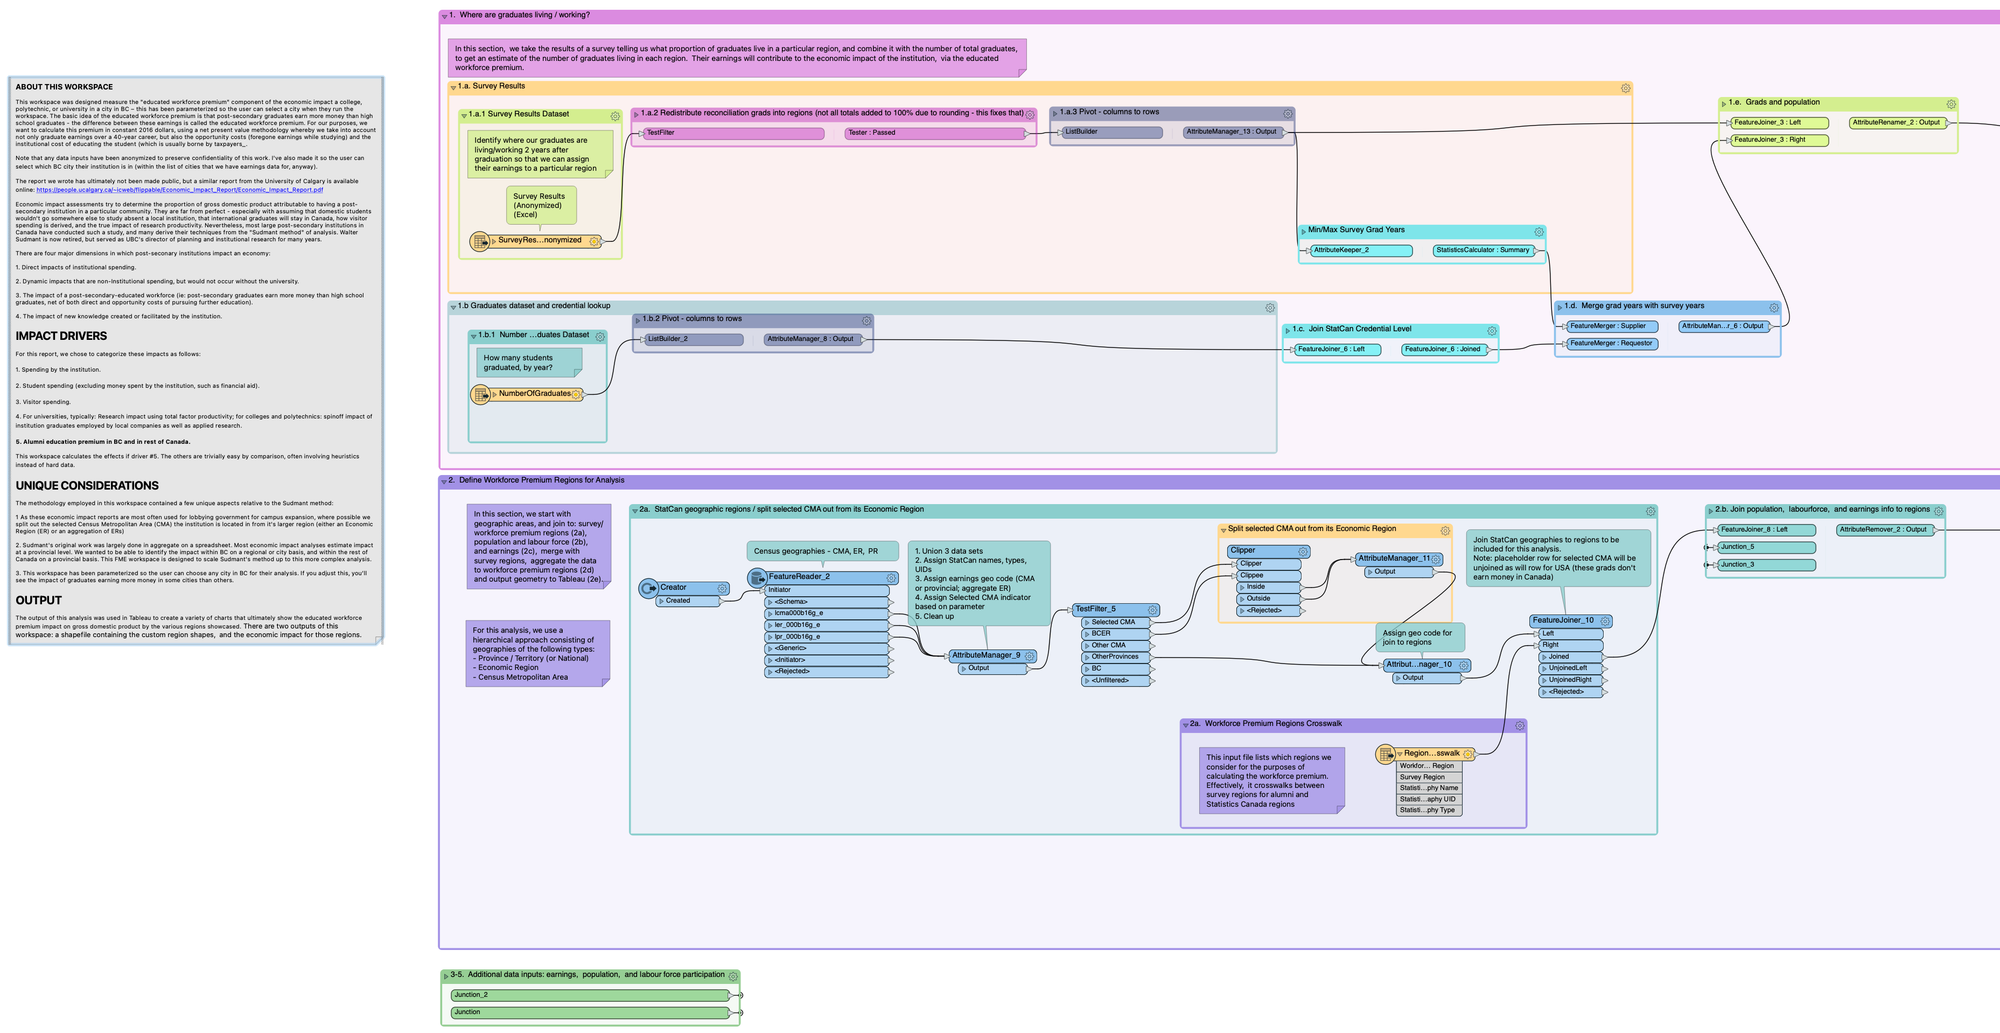
Instead, I use visual workflows for my data integrations. What does a visual workflow look like? Here’s an example we presented at the FME user conference in partnership with Jessica Maitland, an Associate Registrar at Douglas College in Vancouver, Canada. It shows how we picked apart program requirements written as code (called Scribing).

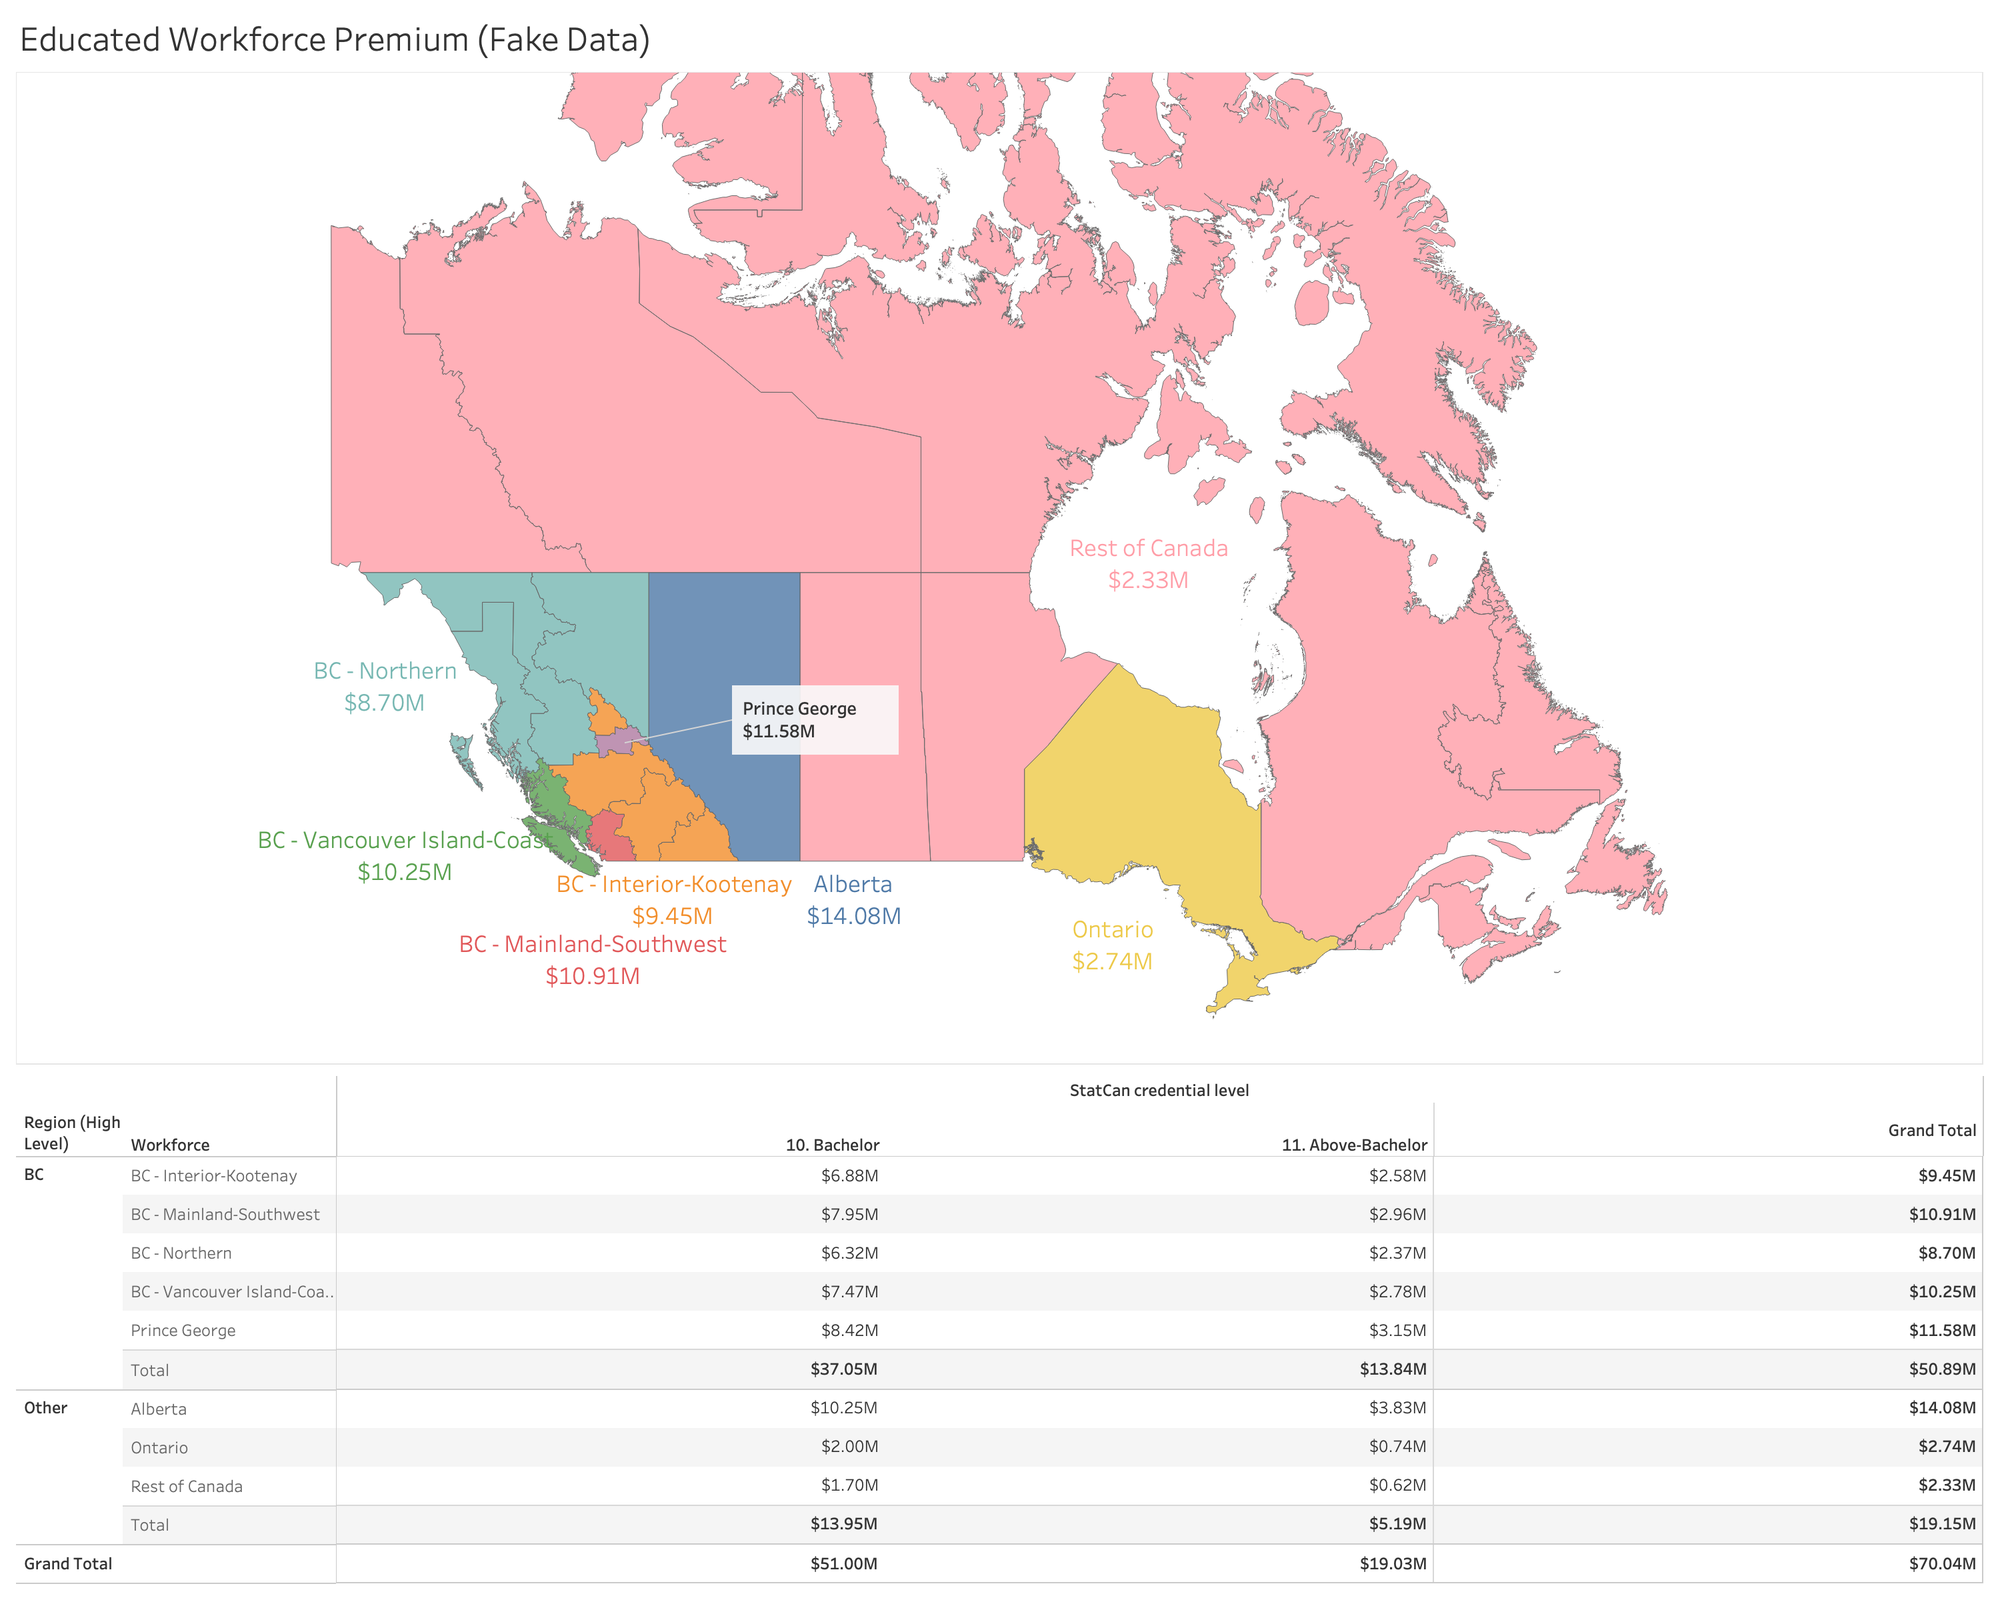
You can also do neat things with data integration tools. Here’s part of the flow for generating an economic impact for a college, polytechnic, or university in British Columbia, Canada. It combines institutional data (survey responses, number of graduates, financials) with data from Statistics Canada (geographic regions, earnings by credential, population, labour force participation, and so on). In this example, I pretended the university I worked with is in Prince George (this is fake data, though there is a great university there).

The map displays the earnings premium associated with completing a bachelor’s or higher degree, within each colour coded region.

My tool of choice is FME from Safe Software; there are, however, dozens of great tools out there such as Alteryx, Tableau Prep, Informatica, Talend, and many others. Most have compelling pricing for educational institutions and can raise productivity for your data engineers, analysts, and even non-technical-stakeholders substantially - here’s why:
· Visual workflows are downright easier to understand, and in turn, easier to debug when something goes wrong. No one enjoys tracing logic through 20,000 lines of code, not even programmers. With an integration tool, you can trace each step of logic to see where challenges occur.
· Visual workflows make data integrations accessible to a wider range of users by providing an interface that empowers non-technical users with the ability to manipulate and trace data. A good example here is working with scheduling coordinators at a college who have now automated their time slot process for Banner without having to write a single line of code.
· Visual workflows present better opportunities to combine data across different data sources than straight SQL against a database. It’s no longer a limitation if I need data from the Student Information System, the CRM, a collection of spatial files, and some spreadsheets(!).
· Visual workflows can leverage intelligent automations and be run on a schedule or when triggered(yes, this is also true of stored procedures, but the interface is clunky at best).
· Visual workflows allow you to write to multiple different places. Perhaps I need my data to end up in a database, published as a Tableau extract, and output to a spreadsheet daily. On top of this, I’d like alerts sent to Slack or MS Teams so that I know everything worked according to plan. With a tool like FME I can do this easily.
· Visual workflows have reusable components, reducing time spent rewriting and adapting code**.** I find copy and pasting a series of transformers, or, better yet, making a custom transformer that can be called by multiple different workflows, is vastly superior to adapting code for use in multiple places.
Now, none of this is to say that SQL is useless - it is a helpful (though not mandatory) building block that will help you more easily construct workflows and diagnose challenges with the data. SQL is also a quick way to run a sanity check to make sure what your data are telling you makes sense.
So, how are you creating your data integrations? If you haven’t already, I’d recommend giving a visual workflow tool a try. With the automations of what you’re currently doing manually, you’ll become more productive with less effort.
PS – I’m an avid reader and have seen many arguments both that SQL is dead and that it will never die. I’m firmly in the latter camp, and can see the benefit of the skillset. I would argue that having SQL as a skill is a huge asset for data integration tools – I’m just a fan of making it more accessible to those who don’t spend their days working in code.
Ready to Learn More about Data Integration and Automation?
